Stretching a bit too much
Posted on
Last weekend I sped up a test suite from ~140 seconds to ~15 seconds by fixing our devise configuration. I wrote this post to describe the issue, walk through how I profiled the test suite, and reflect on performance intuition.
Backstory
Earlier this spring I started a new rails project. Instead of using the traditional layout, I chose a strategy that I've become familiar with at my last two jobs. You can read more about it here. I like it because it helps avoid the pitfall of a monolithic user model - a topic for another day.
We have a monorepo with four rails projects:
/service_provider_application
/homeowner_application
/internal_agent_application
/shared_rails_engine
The rails engine is a dependency of all applications and owns all modeling and business logic. Each application is designed to be used by a single persona. The personas in our domain are typical of a B2B2C project: we have business users (service providers), consumers (homeowners) and internal agents (agent). Because we don't want to maintain bespoke authentication, we use Devise. Each persona (service provider, homeowner and agent) is a devise user who can authenticate into their own application.
There are differences in how each persona authenticates, so we have separate configuration file in each application. The shared rails engine mostly doesn't care about how each persona authenticates, but as the devise user models are central to our business logic they live in the shared rails engine. Thus, it needs a minimal configuration file like so:
require "devise"

Devise.setup do |config|
  require "devise/orm/active_record"
end
Incident
When we started in April our test suites were ripping fast - if only because there were few tests. By October, our test suite in the shared rails engine had grown to comprise ~700 tests and run just over 2 minutes.
One morning, I had a split screen running request tests in one pane and unit tests in the other. I noticed that the unit tests were individually much slower than the request tests. This piqued my interest because it indicated possible low hanging fruit for improving performance.
Profiling our test suite
To profile our tests, I installed the test-prof and stackprof gems.
Then I used speedscope to help narrow my search. 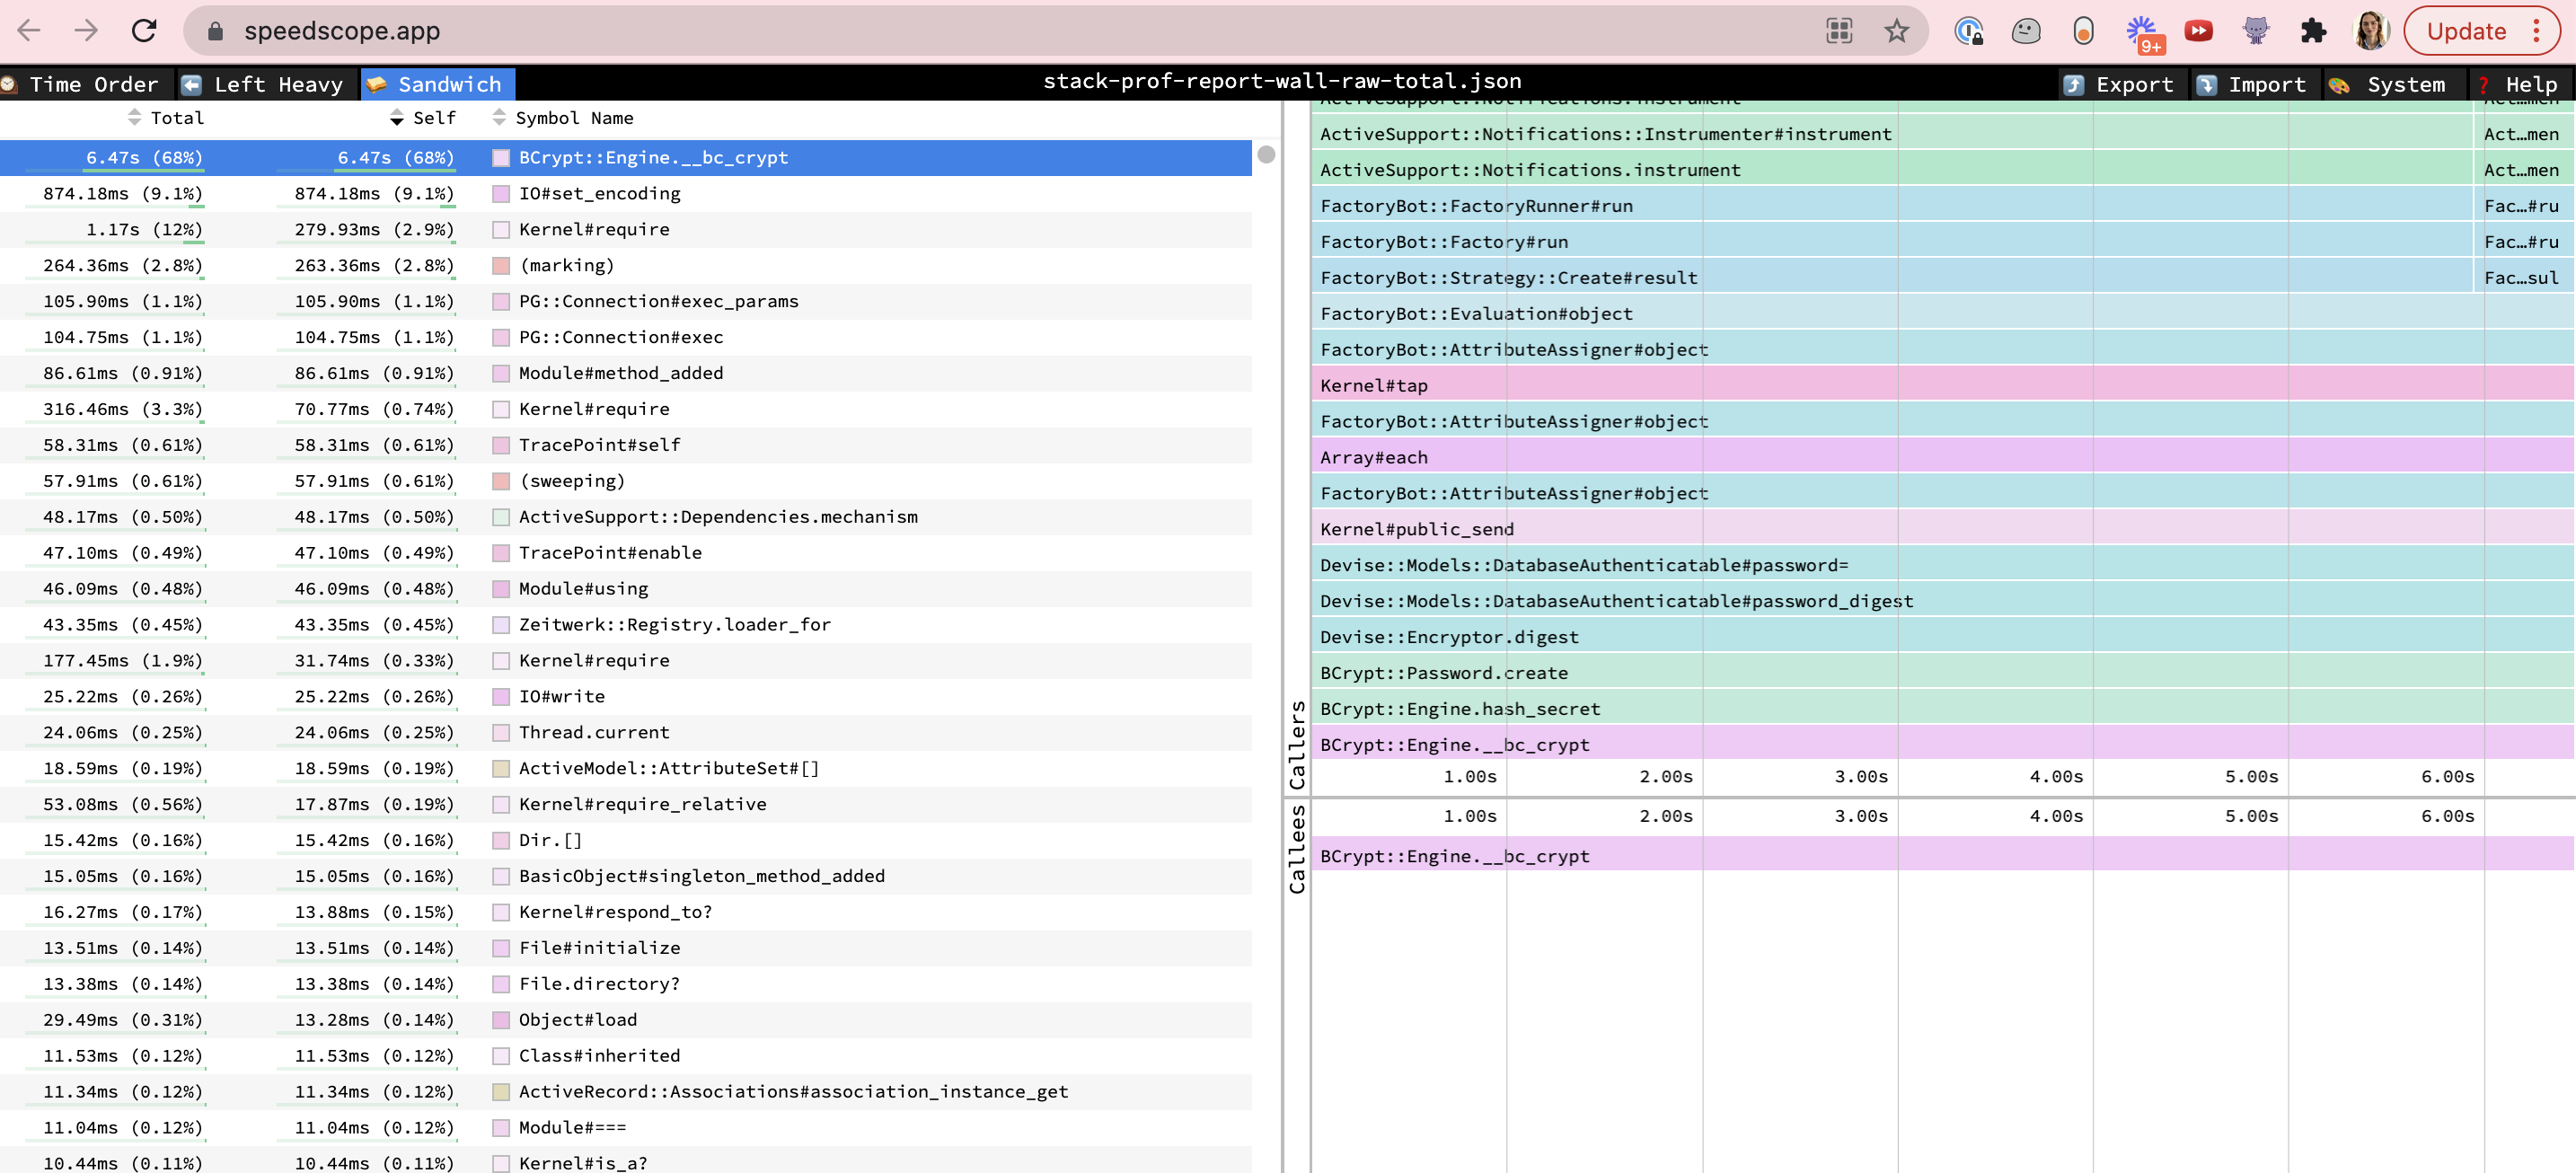
The charts revealed that we spent 6 out of 7 seconds of test execution time in BCrypt::Engine.__bc_crypt. Very surprising!
The only place we use bcrypt is for homeowner passwords via devise. To confirm that creating homeowners was the bottleneck, I ran the following benchmark in the shared rails engine and then in one of our applications.
puts Benchmark.measure { FactoryBot.create(:homeowner) }
Sure enough, it took ~300 milliseconds in the shared rails engine and ~3 milliseconds in the application.
After quickly reading the generated devise configuration. I realized that devise has an option to configure the time spent key stretching.
config.stretches = Rails.env.test? ? 1 : 12
This line was included in each application, but not in the shared rails engine.
Adding this one line to the rails engine cut our test time (in circleCI) from ~140 seconds to ~15 seconds - almost a 10x difference!
Is there anything we can learn from this issue?
- Benchmark your test suite, you might learn something surprising.
- Cultivating performance intuition can help you spot performance bugs before they get out of hand.
What do I mean by the second point?
No alert was fired by this issue. We have no automated way to detect it. Should we have SLOs for our test suite? Maybe someday? Probably not on a project this small. Investigating this bug made me realize I've had this specific problem on previous codebases. The only red flag here was that I happened to notice that a test in the spec/models directory was much slower than a test in the spec/requests directory. This observation violated my intuition of the comparative speed of these types of tests. My intuition is that rails test times should break down roughly like this:
From slowest to fastest:
- System or feature test
- Request tests
- Model tests that hit the database
- Any tests that don't hit the database (helpers, models, view components, etc.)
This kind of tiered performance intuition is a useful tool for understanding your code. Violations can be valuable leading indicators of performance bugs. Similar tiers exist in production systems - e.g. network access, database access, disk access, memory access. If some memory access is taking longer than database access, you probably have an issue. What are the tiers in your system?